![iseatz-logo-white.png]](https://www.iseatz.com/hs-fs/hubfs/IZ%20Logos/iseatz-logo-white.png?height=40&name=iseatz-logo-white.png)
Skimming the Results Table
After executing a query, the results table will appear below your query editor. Here are some tips for skimming the results:
- Column Headers: The first row of the table contains the column names. These represent the data fields you selected in your query (e.g.,
customer_name,order_date). - Scrollable View: If the table contains many columns or rows, use the scrollbars to navigate horizontally or vertically.
Using Results Features
Sorting Columns
- Click on the three dots on any column header to sort the data by that column in ascending or descending order.
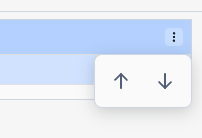
- For example, clicking the
order_datecolumn will arrange the rows from earliest to latest or vice versa. - A small arrow will appear in the header to indicate the sort order.
- For example, clicking the
Column Details
- View Column Metadata: Click a column header to access details like data type and formatting options. This is especially useful for understanding fields with numeric or date-based data.
Filtering Results
- Use the Filter Sidebar on the right-hand side to refine your results:
- Click the filter icon (funnel symbol) next to a column header or in the sidebar. (JOHN, do you have a funnel symbol??)
- Enter filter criteria (e.g.,
> 100for numeric columns orcontains 'Jane'for text). - Apply the filter to update the displayed rows.
Exporting Data
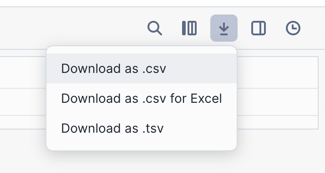
- If you need to work with the data outside Snowflake, click the Download icon above the results table. This allows you to download the data as a CSV file for further analysis.
Creating Charts from Query Results
Snowflake offers a built-in charting feature to help visualize query results directly in the interface.
-
Open the Chart Tab:
- Above the results table, click the "Chart" tab (next to the "Results" tab).
- This will open the chart editor, showing options to visualize your data.
-
Select Chart Type:
- Snowflake supports different chart types, including bar charts, line charts, scatter plots, and heatgrid. Choose the one that best represents your data.
-
Assign Columns to Axes:
- Select the column names into the fields for the X-axis, Y-axis, or other dimensions as required.
- For example, set
order_dateon the X-axis andtotal_amounton the Y-axis to create a time-series chart of order totals.
-
Customize the Chart:
- Adjust the chart appearance by adjusting the labels, orientation, and axis ranges as needed to make the chart more informative.
-
Save or Export the Chart:
- Once your chart is ready, you can take a screenshot or save the visualization for reporting purposes.
Tips & Troubleshooting
- Missing Sidebar or Filters: If you don’t see the filter sidebar, ensure it’s enabled in your Snowflake account settings. Look for a toggle in the results view.
- Large Datasets: Charts and filters may perform slowly with large result sets. Refine your query using a
LIMITclause to retrieve a smaller subset of data for analysis. - Error in Chart Creation: Check that the columns assigned to axes are compatible with the selected chart type (e.g., dates for the X-axis in a line chart).
Need More Help?
If you’re unsure how to interpret your query results or make use of the charting features, don’t hesitate to reach out to your team or iSeatz support. They can provide assistance to help you make the most of Snowflake's capabilities.
Happy exploring!